Michigan Outdoor Recreation Industry Office Data
Understanding the Federal Bureau of Economic Analysis Outdoor Recreation Satellite AccountThe Bureau of Economic Analysis (BEA) created the Outdoor Recreation Satellite Account (ORSA) to serve as a single official source of information on the size and composition of the outdoor recreation economy at the state and national levels.
The ORSA dataset provides state and national information on value added by outdoor recreation to Gross Domestic Product (GDP), outdoor recreation employment, and total compensation of those employees by industry; to better understand the value added to Michigan’s economy by outdoor recreation related to tourism, but also to outdoor product manufacturing, transportation, etc.
The interactive graphs and charts listed below display the industry and activity breakdowns of the outdoor recreation economy for Michigan and other states in a selected year – extending from 2017 to 2022. Learn and better understand key terms and official BEA definitions, including the official definitions of value added, employment and total compensation, in the data overview.
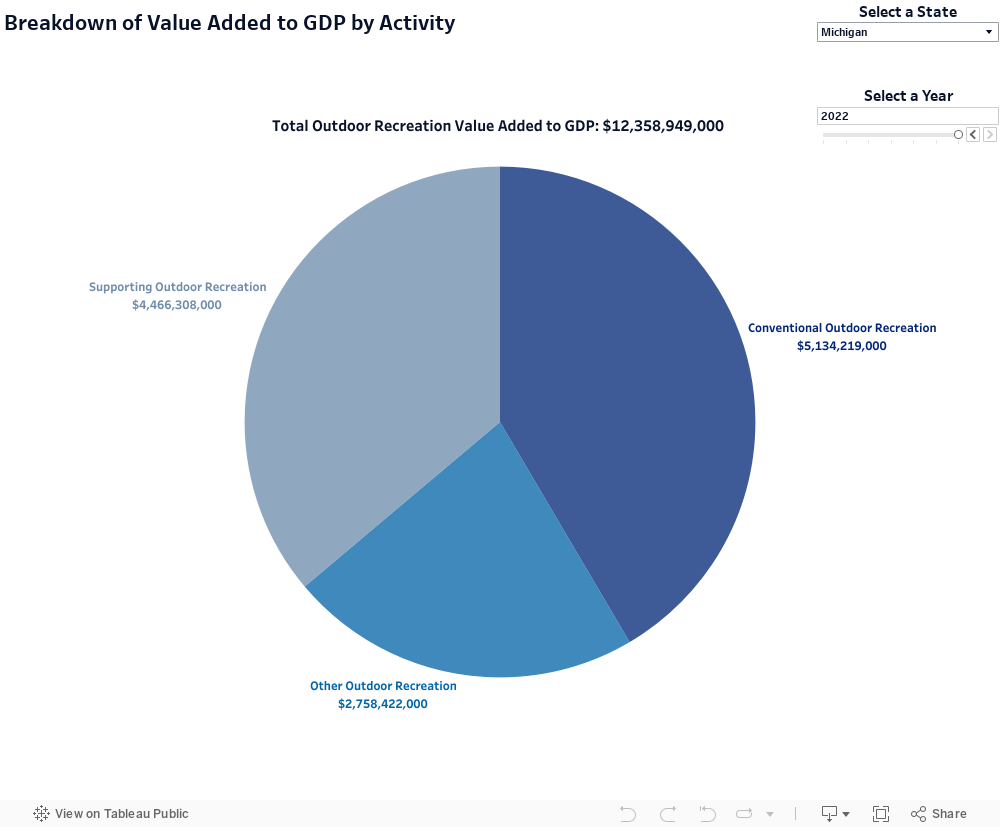
Composition of the Outdoor Recreation Economy by Activity Type
View the value added to GDP by outdoor recreation economic activity, with the default set to look at Michigan for the most recent available data (2022), broken down by category of recreation activity including: Conventional Outdoor Recreation (biking fishing, camping, etc.), Other Outdoor Recreation (sporting events, festivals, beachgoing, etc.), or Supporting Outdoor Recreation (lodging, shopping, transportation, etc.).
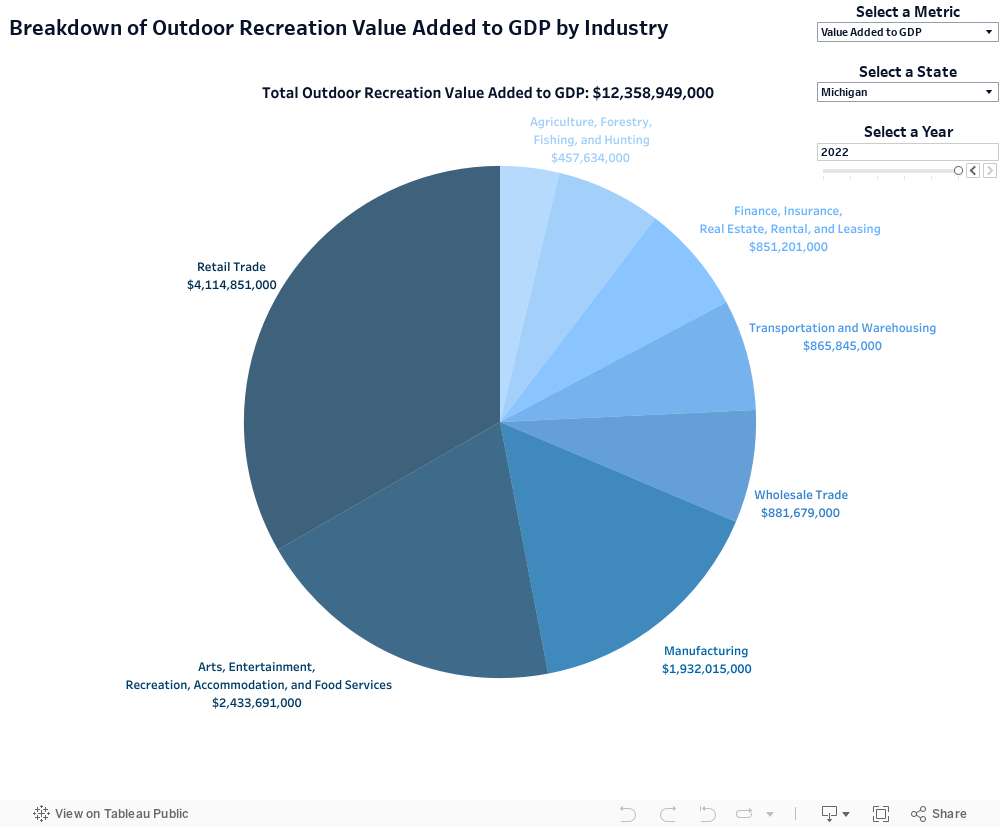
Composition of the Outdoor Recreation Economy by Industry Segment
View the outdoor recreation value added to GDP, employment, and total compensation to those employees, with the default set to look at Michigan for the most recent available data (2022), broken down by industry:
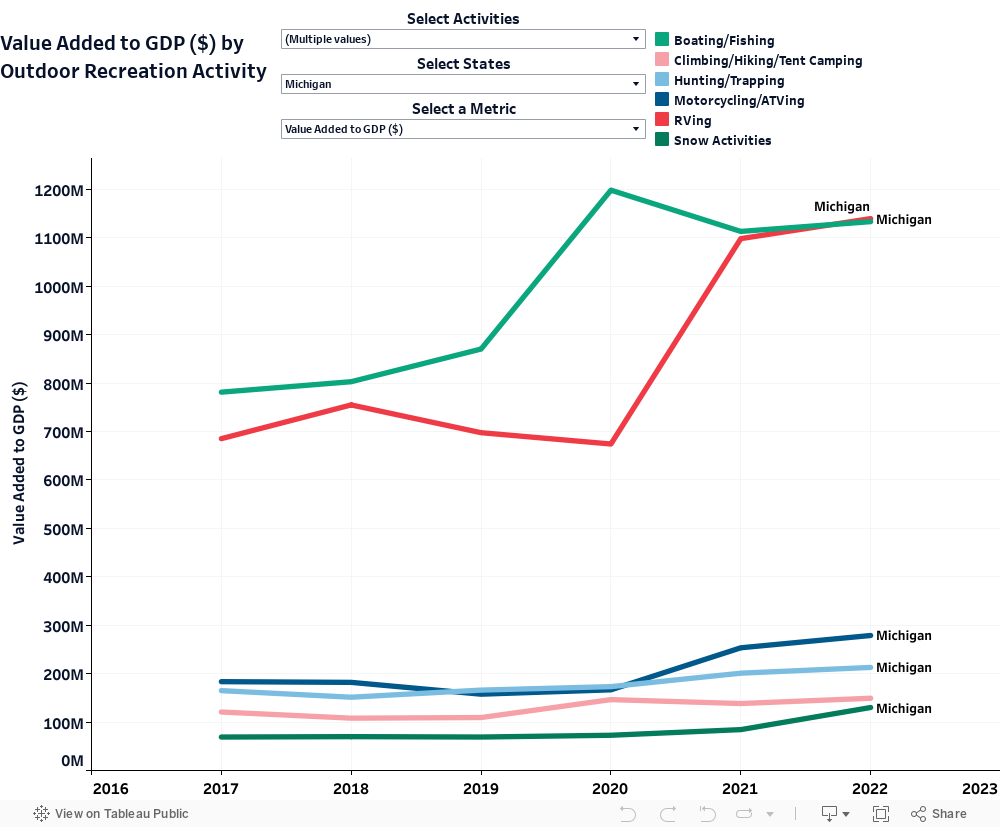
Value Added by Outdoor Recreation Activity
View the selected metric of outdoor recreation economic activity across time for the selected activities and states. Compare states to themselves over time for a given metric-activity combination, compare activities within the same state, and compare states to other states for the same activity. Metrics include value added in dollars and value added as a share of state GDP. Michigan outdoor recreation business owners can use these data to better understand the economic size of the activities they support as well as their own market share.
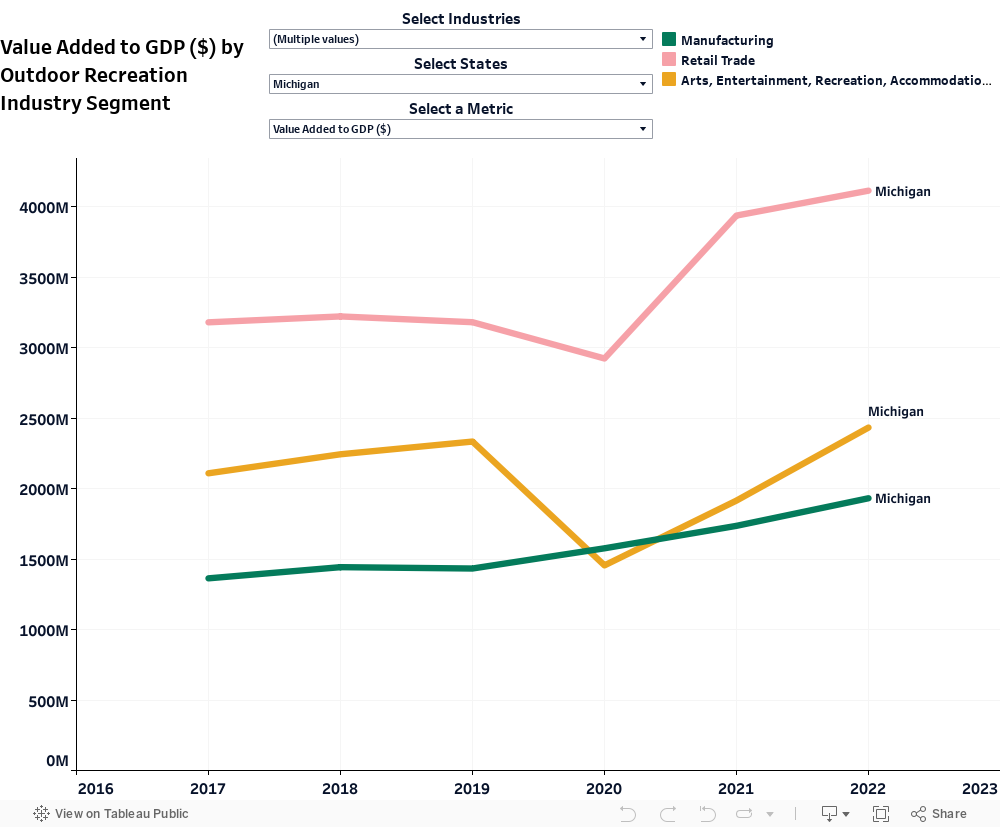
Economic Activity by Industry Segment
View the chart below for the metric of outdoor recreation economic activity across time for selected industries and states. Compare Michigan to other states for a variety of value added, employment, and compensation metrics.
For example; the metric of the average compensation relative to the average of all jobs in the state indicates whether an outdoor recreation job in a given industry pays more or less than the average of all jobs in that given state. Values over 100% indicate that the outdoor recreation jobs in that industry tend to pay more than the state average.